Bad Ads On Websites

René Ritchie is right to compare ad-exchanges to black-boxes, you never know what you’ll get :

We also have no ability to screen ad exchange ads ahead of time; we get what they give us. We can and have set policies, for example, to disallow autoplay video or audio ads. But we get them anyway, even from Google. Whether advertisers make mistakes or try to sneak around the restrictions and don’t get caught, we can’t tell. It happens, though, all the time.

When bad ads appear, we report them and ask that they be disabled. Since different people in different geographies see different ads, it can be a challenge to identify them, and it can take a while to get them pulled. It’s a horrible process for everyone involved.

It’s so bad, our tech team has been exploring their own “bad ads” extension that would identify any resource-heavy ads that violate our policies, and provide us with better information so the ad network can more easily find and kill them. And yes, we’re well aware of how insane that sounds.

→ iMore

Apple I To Be Recycled Fetches $200,000

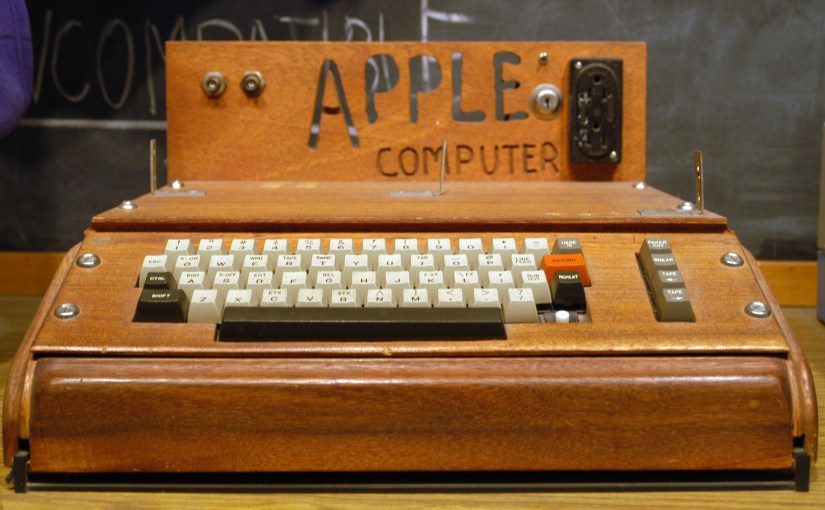
A South Bay recycling firm is looking for a woman who, in early April, dropped off boxes of electronics that she had cleaned out from her house after her husband died. About two weeks later, the firm, Clean Bay Area, discovered inside one of the boxes a rare find: a vintage Apple I, one of only about 200 first-generation desktop computers put together by Steve Jobs, Steve Wozniak and Ron Wayne in 1976.

The recycling firm sold the Apple I this month for $200,000 to a private collection, Vice President Victor Gichun said. And now, because company policy is to split proceeds 50-50 with the donor, he’s looking for the mystery woman who refused to get a receipt or leave her name.

“We are looking for her to give her $100,000,” Gichun said.

→ San Jose Mercury News

Moving Averages and the iPad

There are myriad other ways to smooth a graph without switching to cumulative figures. One of the simplest is the moving average. In this technique, instead of plotting the raw data, you plot the average of a few data points in the neighborhood of each time value.

For many data sets, the best size of this neighborhood is not obvious. With Apple’s sales figures, though, I think it’s clear that the best choice is to average over four quarters: the quarter that you’re plotting and the three previous. This smooths over the seasonal jumpiness while not including so much past data as to ignore real trends.

→ Lean Crew